by Karen Todd
Coronavirus has made its way around the world. We are currently in a pandemic. Coronavirus is now in even the remotest of places. This is becoming a huge concern for people worldwide who want to know the ongoing situation around the world. People who have no updates about what is going on get caught in a lot of anxiety. Lack of knowledge and adequate information is more deadly and dangerous than we can think. It can have very bad consequences. Therefore, it is vital in this time to be informed and stay connected with whatever is going around us.
There are many different ways through which people can stay connected with this situation. People want to know about how widely spread coronavirus is and which areas are the most affected. There are many apps, websites and, dashboards that provide this COVID-19 Statistic. The dashboards that provide the most authentic and reliable information are listed below . We have filtered out all the sources of information that were not real and true. We must bring forward the most reliable facts as incorrect sources can spread more panic than we can realize.
Contents
The chart below lists the above dashboards along with their pros and cons.
Dashboard | Pros | Cons |
Johns Hopkins University Dashboard |
|
|
HealthMap |
|
|
World Health Organization's dashboard |
|
|
NextStrain |
|
|
The New York Times' Dashboard |
|
|
Therefore, we have stated below the sources that can be easily relied upon.

Lauren Gardner came up with this dashboard on January 22nd. Since then, this website has been visited more than 200 million times by different people all across the world. It came out after a couple of weeks of the virus's outbreak. It is one of the most widely searched and accessed dashboards . It keeps itself up to date regarding the outbreak. The sources of information are both national and international make it a reliable dashboard.
You can zoom in on your desired country and get information about it. This information includes the number of people who are currently confirmed by testing positive , people who recovered and also the number of people who have unfortunately died because of this outbreak. You can get information worldwide but also by selecting different countries and extracting information about it. The link to their dashboard is provided below.

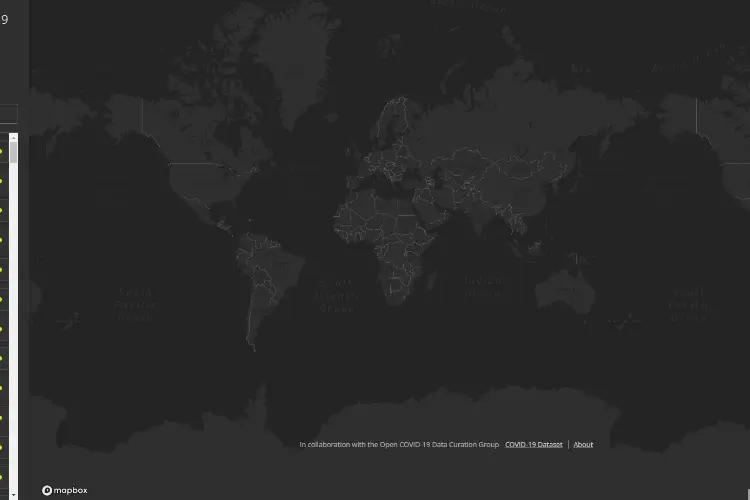
This dashboard was initially founded in 2006. The information that is available on HealthMap is from both local governments provided sources as well as international news outlets . HealthMap covers any outbreak or disease that is affecting the world. All diseases that can be of a threat to the public welfare are covered in this dashboard. Similarly, Coronavirus is no exception. HealthMap has covered this outbreak as well as making sure that people are well informed and up to date about the situation going on.
HealthMap provides information that is updated. Information on this dashboard is updated every hour. The accuracy percentage is as high as 90%. The number of cases is color-coded . This helps you in spotting the number of people affected by just taking a glance at it. You can easily find out where this virus has spread and to how much extent. This will help you in understanding the situation better resulting in an appropriate response in this time of need. HealthMap provides you with three main kinds of information.
There is a whole team of people that investigate and then map out this outbreak. This makes sure that people receive the most accurate and relevant information in real-time. The link to their dashboard is provided below.

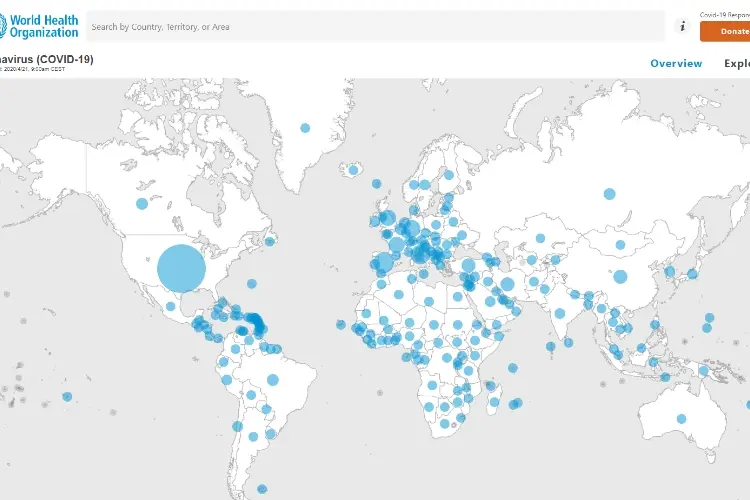
World Health Organization has the dashboard that collects data directly from the countries and then shows it on its dashboard. It gives an overview of the situation that is currently taking the world by the storm. It provides information regarding it. The information is up to date and can easily be relied upon. It is a platform that provides very comprehensive information that can be utilized by the people for their benefit.
In this dashboard, they have provided a lot of information. It provides details about the confirmed cases both nationwide and worldwide . You can find out each country's statistics by clicking on it. There is also a chart available that tells you how many cases are identified as positive daily and then all together. It also gives information about the deaths that have resulted due to this pandemic. Not only this but they have also added a new feature that lets you choose variables of your choice. You can then place them across the axis and see how they each respond to one another. This helps in finding correlations between different variables.
World Health Organization is continuously working to make their dashboard better than before. They have a lot of features they want to add and are working towards it. The link to their dashboard is provided below.

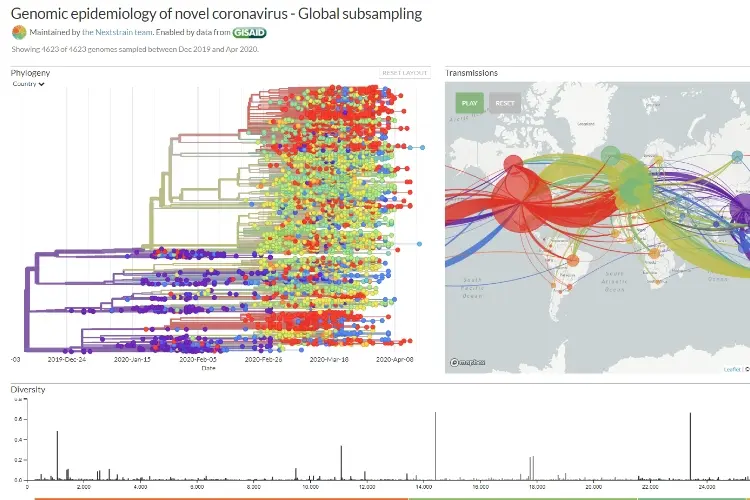
This dashboard is undoubtedly the most technical out of all the dashboards. It is not a dashboard that everyone will appreciate. It will be found suitable for people of certain backgrounds and preferred tastes. If you are enthusiastic about learning every single detail regarding the Coronavirus and its outbreak, then this dashboard is definitely for you. It will provide you information about its genomic evolution as well. It combines data from labs all around the globe. It observes and researches on the genome and then comes up with a genomic tree for people to view. Scientists and people who have a technical background will find NextStrain quite interesting as well.
The dashboard is updated very frequently. It takes real-time into consideration. It monitors all the data provided and how it has eventually evolved. Not only this but it also shows how the virus spread from one country to another. Last but not the least, NextStrain also features the option for you to filter your searches . It can be done according to the country, labs that gave in the results, locations, etc. The link to their dashboard is provided below.

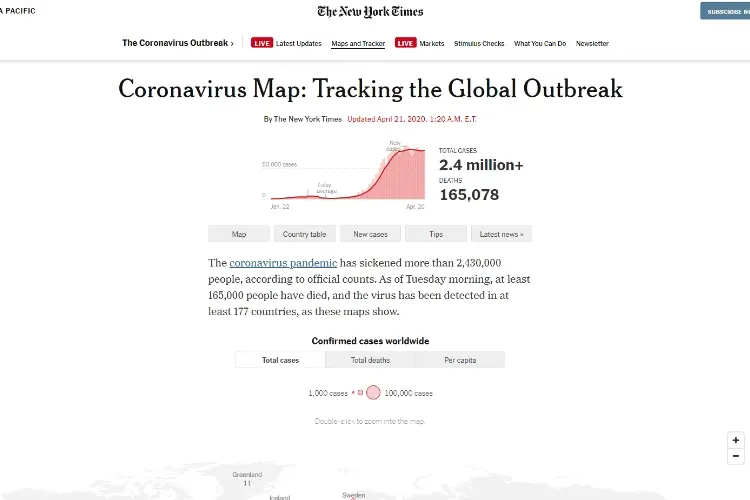
The New York Times is a very well-established name in the field of journalism. It comes as no surprise that the dashboard it created is very simple to understand. It is user friendly and gets the message across the readers without much hindrance. It is well-rounded and contains all the necessary information that you can require from a dashboard. The charts it has been very easy to read and make use of. It is also a very good source for people who are not that good with visual information and prefer written text instead. The New York Times solves this issue by coming up with a dashboard that has many variations of the information . Data is provided in many forms and people can easily use the one they find the most convenient.
Their dashboard consists of a lot of information. It includes the number of people affected and the number of people who died . This is then further divided into different regions and countries . It also includes graphs and tables that are very easy to understand. All the articles by The New York Times on this topic can be read by anyone without any charges. However, it does not contain any individual data. It does not show any data about how many people are affected each day. It shows data in a cumulative form. The link to their dashboard is provided below.
It is safe to say that all the above dashboards are reliable and provide accurate information. They all differ in their layouts and how they present the data . They also vary in the variations and the kind of data they provide. Some of the above dashboards provide charts and tables more comprehensively than the other dashboards. Not to forget that some update their data in real-time while others do not. However, regardless of their differences, they all are very reliable in the data they provide.

About Karen Todd
Karen Todd's journey as a talented blogger is a testament to her passion, creativity, and commitment to delivering high-quality content. Through her writing, she has the ability to educate, entertain, and inspire, making her a beloved figure in the blogging world.
 |
 |
 |
 |
Recent Ones
Come here for FREE Gifts. We want to share some nice tips and great tricks. First, disable your adblocker for them
Once done, hit anything below
 |
 |
 |
 |